MARKETS / IDEAS / PERSPECTIVE CHECK MOBILE VIEW ↗
US STOCKS
RESEARCH & PERSPECTIVE
AP INVESTMarket research
AP INVEST / RESEARCH

A daily habit.
A deeper perspective.

A framework for reading US stocks: direction, participation, leadership and conditional setups. Explore each lens below, then see how it connects to the reports.

View Samples
Unlock with email →
THE RESEARCH FRAMEWORK

Understand the reasoning
behind the report.

Each lens answers a different question. Read them together to build context before focusing on an individual stock.

Educational illustrations below use hypothetical examples. They are not current market readings or trade recommendations.
01
Market direction

First, read the environment.

Read the explanation

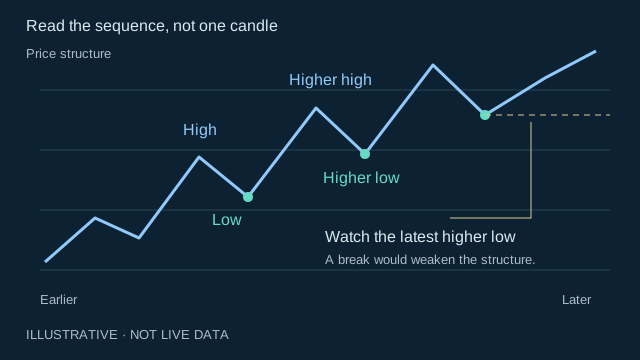
A strong session matters more when it fits a durable trend. Read the sequence of highs and lows before interpreting the latest move.

Compare the major indexes, then check daily and weekly price structure. Higher highs and higher lows describe an advancing trend; repeated failures at resistance or a break of support can challenge it. Moving averages help organise that picture, but they lag price.

What we examine

Look for agreement across indexes, the slope of key moving averages and how price behaves on pullbacks.

Unlock with email →
Price structure · Higher highs and higher lows. Hypothetical example.Open full-size diagram ↗
Read the graphicThe rising path is interrupted by pullbacks. The latest higher low gives the analyst a concrete level to monitor, rather than treating every red session as a trend reversal.
WHAT WOULD CHANGE THE VIEW?

A sustained loss of support or a failed recovery would weaken the constructive interpretation. One close alone does not settle the question.

Back to the four topics ↑
02
Breadth & risk

How many stocks are taking part?

Read the explanation

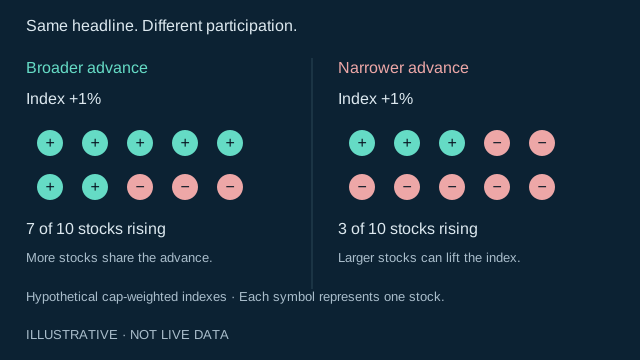
An index can rise while many of its stocks struggle. Breadth asks whether participation supports the headline.

Count advancing and declining stocks within a defined universe. Follow the percentage above key moving averages and the balance of new highs and lows. Compare these measures over time; changing the universe or lookback can change the answer.

What we examine

Look for participation expanding with the index. Narrowing participation is a reason to investigate, not an automatic sell signal.

Unlock with email →
Participation · The index does not tell the whole story. Hypothetical example.Open full-size diagram ↗
Read the graphicBoth hypothetical cap-weighted indexes gain 1%. In one, seven of ten stocks rise; in the other, only three do. Larger constituents can lift an index despite weakness underneath.
WHAT WOULD CHANGE THE VIEW?

Fewer stocks holding their trends, alongside rising volatility, would make the backdrop less supportive. Breadth is a separate lens; it is not a component of our demo’s current Health v4 score.

Back to the four topics ↑
03
Sector rotation

Follow changing leadership.

Read the explanation

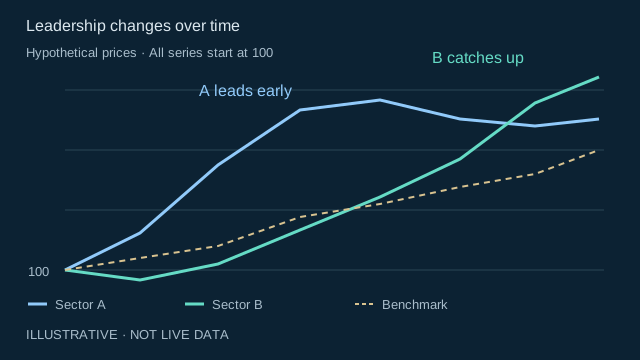
Leadership is a comparison, not just a green number. A sector can outperform while falling less than the market.

Compare sectors with the same benchmark over the same dates. A rising sector-to-benchmark price ratio indicates relative outperformance. Then ask whether that advantage is strengthening or fading, and whether several stocks within the group confirm it.

What we examine

Separate absolute returns from relative strength. Look for sustained improvement across a group, rather than relying on one strong constituent.

Unlock with email →
Relative performance · Use the same dates and benchmark. Hypothetical example.Open full-size diagram ↗
Read the graphicAll three hypothetical series start at 100. Sector A leads initially, but Sector B catches up as A flattens. This is a comparison of price behaviour, not a measurement of money flowing between sectors.
WHAT WOULD CHANGE THE VIEW?

Leadership can stall or reverse; there is no guaranteed rotation sequence. Relative strength comparison is also different from RSI, which measures a security’s own price momentum.

Back to the four topics ↑
04
Stock setups

Turn an idea into a conditional plan.

Read the explanation

A watchlist is a preparation tool. It separates an interesting company from a setup with clear conditions.

Start with the business and its group, then examine trend, relative strength, liquidity and nearby price levels. Identify the condition being monitored, the evidence needed to support it and the event risks that could disrupt it.

What we examine

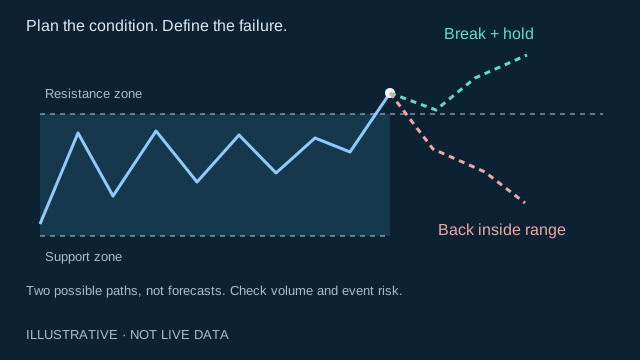
Check whether a move clears the relevant zone, whether it holds and how volume compares with its recent baseline. Review earnings and other company events before drawing a conclusion.

Unlock with email →

Conditional scenarios · Confirmation and invalidation. Hypothetical example.Open full-size diagram ↗
Read the graphicThe solid line shows a hypothetical consolidation. Dashed paths illustrate two possibilities: a break that holds, or a failure back inside the range. Neither path is a prediction.
WHAT WOULD CHANGE THE VIEW?

A failed breakout or loss of the planned support area can invalidate the setup. A gap can bypass a stop, so a chart level is not a guarantee of the exit price.

Back to the four topics ↑
Explore the concepts

Further reading: Fidelity: technical analysis · Support and resistance · Indicator reference: breadth and relative strength (PDF).

Charts organise evidence; they do not remove uncertainty. AP INVEST research is educational and is not personalised investment advice.

PUT THE FRAMEWORK IN CONTEXT

Inside the reports.

Browse the dated samples below to see the depth and format of each publication.

Start with our free samples.Get the sample pack →
DAILY MARKET REPORTS

Start with context.

Understand the market environment before focusing on a stock.

  • Index direction and technical structure
  • Market participation and risk conditions
  • Sector and theme leadership
WEEKLY REVIEW

Step back.
See what is changing.

A deeper review of the week's market structure, leadership and emerging themes.

  • Weekly market context
  • Sector and industry comparisons
  • Key developments to watch next
STOCKS WATCHLIST

From themes
to individual setups.

Screen, group and compare shortlisted stocks. Then define the next setup worth watching.

  • Rank names by setup quality
  • Identify collective industry and theme moves
  • Compare strength with the index and peers
04 / COMPANY ANALYSIS

Understand the company behind the ticker.

Connect the business to the chart. Explore fundamentals, competitors, price structure, key levels and conditional scenarios.

Sample: Micron (MU), prepared 26 September 2026.

05 / EDUCATIONAL NOTES ON PATREON

Six chapters. One learning journey.

Start with the fundamentals, then build a repeatable approach to understanding markets and planning trades.

Explore the six chapters
  1. Money, the economy and the assets you invest in.

  2. Businesses, financial statements, valuation and how markets work.

  3. Market conditions, breadth, sectors, themes and macro context.

  4. Trends, price action, volume, relative strength and chart patterns.

  5. Screening, watchlists, entries, exits, position sizing and risk.

  6. Preparation, trading psychology, journaling and reviewing decisions.

GO DEEPER

Your research, at your pace.

Two memberships available · Pro coming later
02 / PLUS

AP INVEST Plus

Take the research down to stock level.

For readers who want market context plus deeper stock and theme research.

  • Everything in Market Research
  • Stock, sector and theme watchlists
  • Company analysis and news blogs
  • Member-only community
Unlock with email →

Current price and billing options are shown on Patreon.

View Plus on Patreon →
03 / PRO · COMING LATER

AP INVEST Pro

The next chapter of AP INVEST.

We’re developing the next level of the research experience.

  • In development
  • Features and pricing announced before launch
Follow Pro updates →

Current membership prices and billing options are shown on Patreon.

AP INVEST