Does a green market day mean a broad recovery?
No—a green market day does not by itself establish a broad recovery. On 25 September 2026, all four major index ETFs rose, but small caps and equal weight still lagged. The report treated the move as a rebound awaiting broader follow-through.
A rebound is one observation
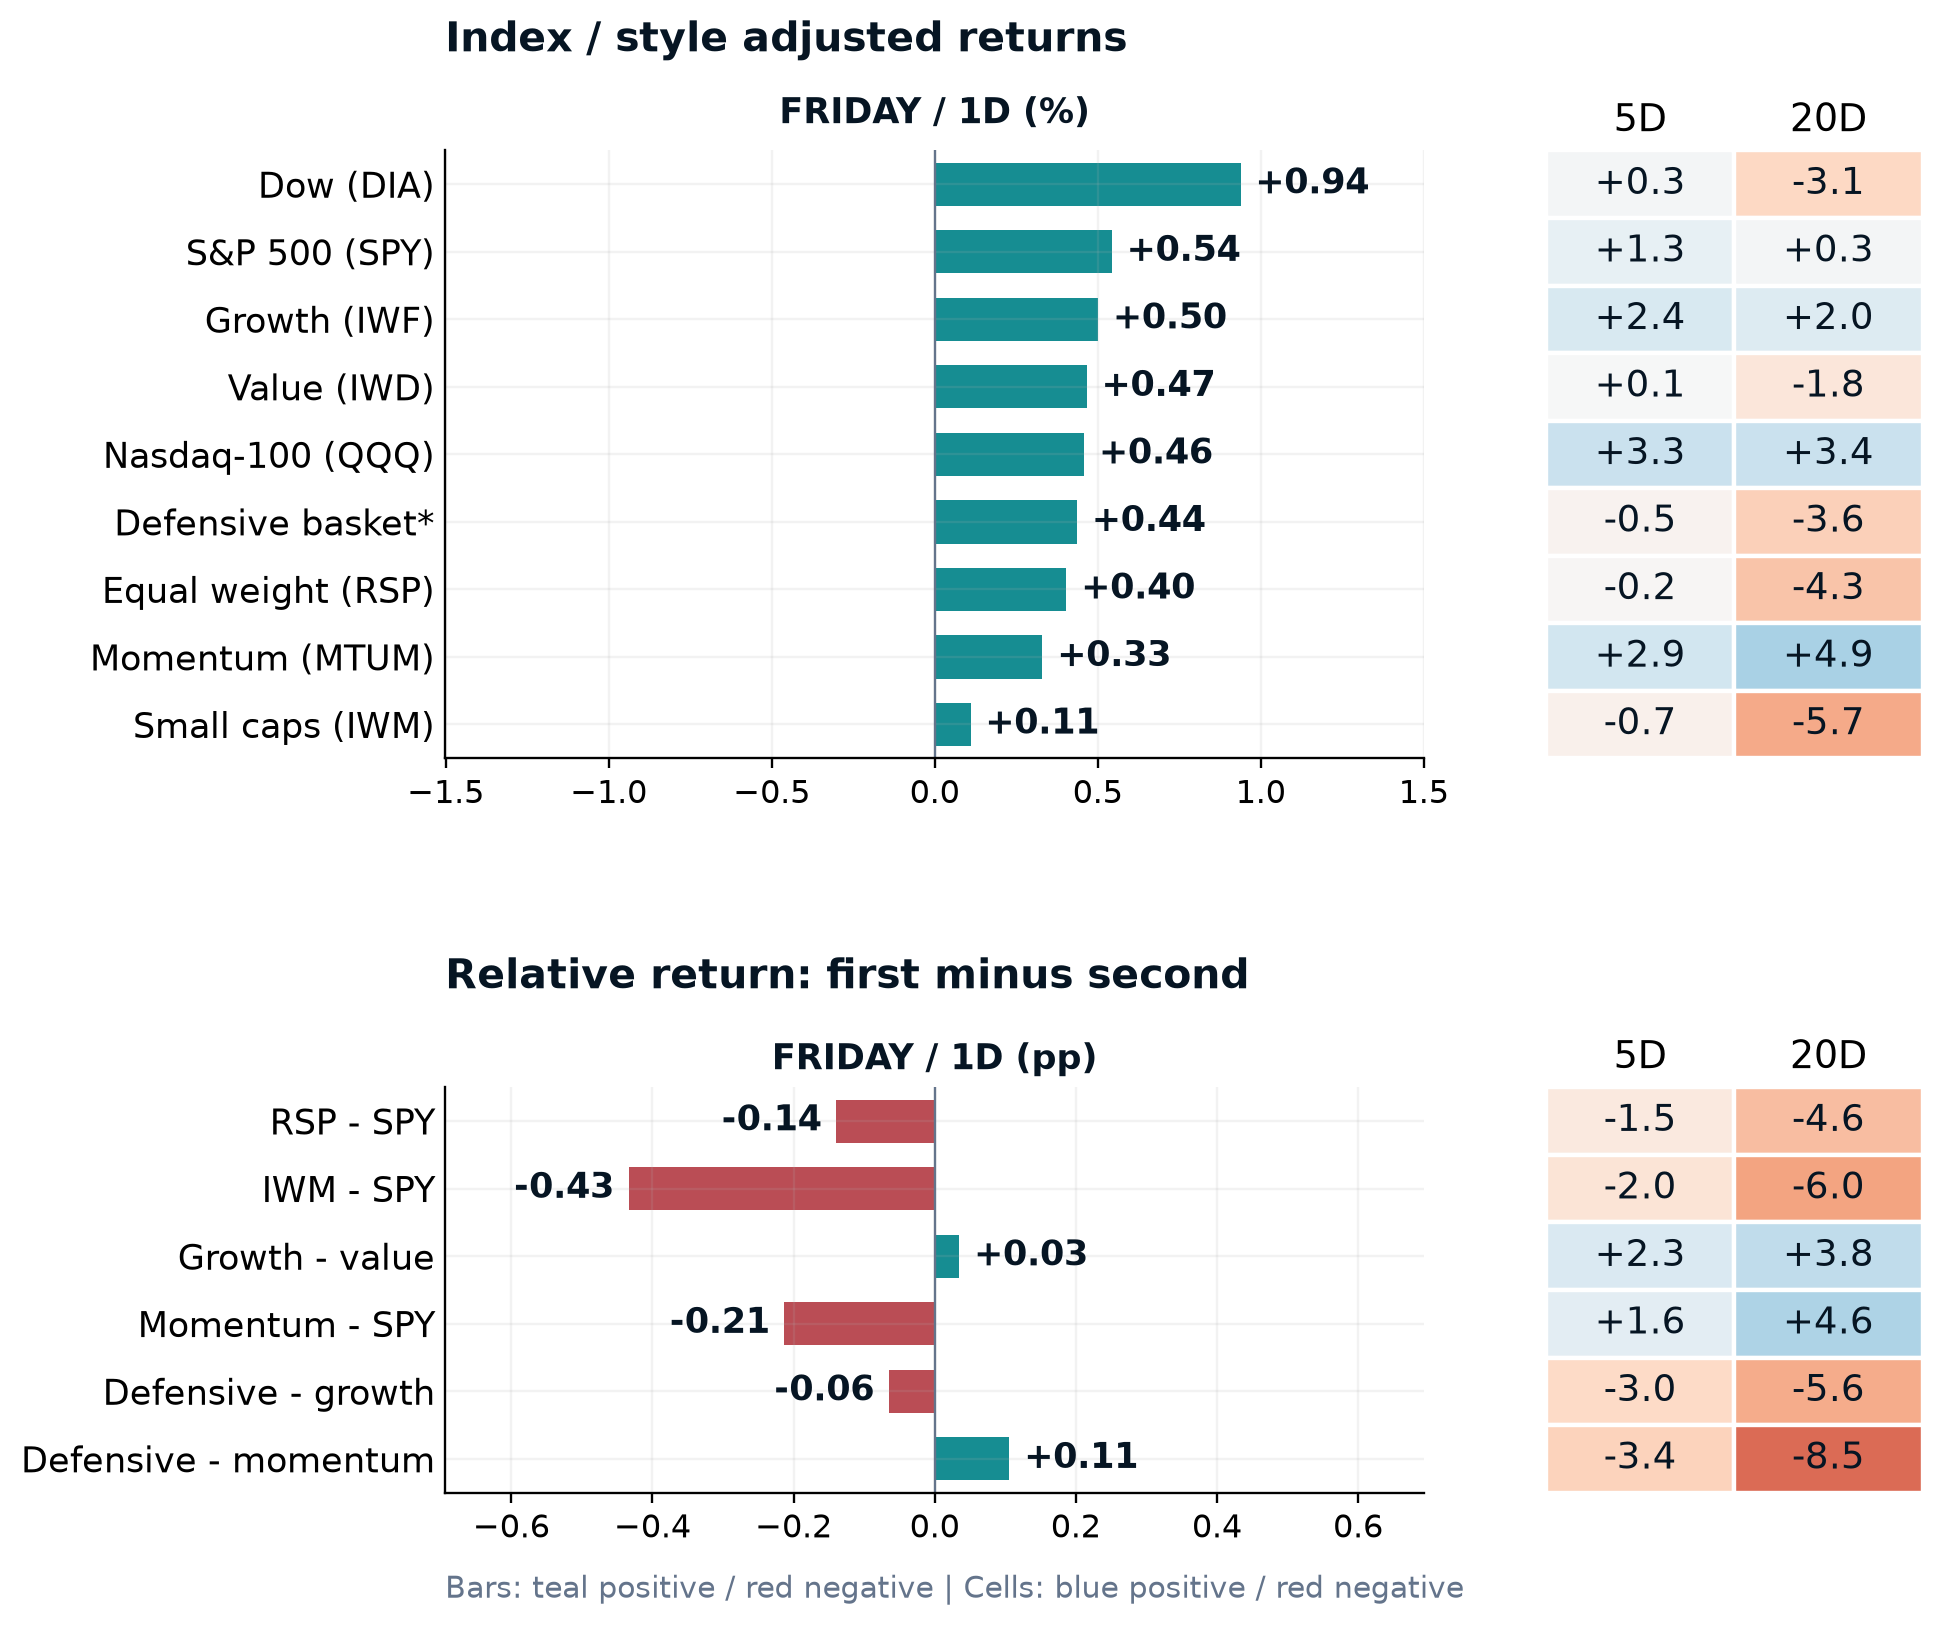
The Daily Market Report showed DIA, the Dow ETF, up 0.94% for the session. SPY gained 0.54%, QQQ 0.46% and small-cap IWM just 0.11%. All were positive, but the size of the gains differed substantially.
The longer window changed the interpretation. DIA was still down 3.1% over 20 sessions, while IWM was down 5.7%. A strong day for the Dow had not yet repaired its recent decline. The report therefore treated the move as a rebound, not evidence of lasting leadership.
 DAILY MARKET REPORT · 25 SEP 2026
Check who is participating
Equal-weight RSP rose 0.40%, trailing SPY by 0.14 percentage points that day. The report recorded RSP’s shortfall as 1.45 points over five sessions and 4.59 points over 20 sessions. A positive close had not reversed that persistent relative weakness.
Why compare the two? The S&P 500 Equal Weight Index uses the same constituent universe as the capitalization-weighted S&P 500, but resets company weights equally at quarterly rebalances. It provides a different view of participation by reducing the influence of the largest companies. [2]
RSP versus SPY is a useful comparison, not a count of advancing stocks. Sector weights, rebalancing and ETF tracking also affect returns. The gap alone cannot establish how many individual stocks rose or explain any particular portfolio’s performance.
Positive direction. Uneven support.
Our reading was that the session improved prices without resolving the divergence across market groups. One day was insufficient to conclude that leadership had rotated or that the recovery had broadened.
What would change that reading?
Follow-through from small caps and improving equal-weight performance would strengthen the broadening case. Continuing weakness in those groups would keep the assessment selective. Direct breadth measures, using a consistent stock universe, would provide additional evidence.
This is a question to monitor across subsequent sessions, not a prediction from the chart. The example explains the report’s reasoning at its stated cutoff; it makes no claim about what happened afterward.
Sources & scope
[1] AP INVEST, Daily Market Report, 25 September 2026, “Index and style comparison,” research page 03/10 (PDF page 5). Values are reproduced from that edition, not a fresh market-data calculation. The report identifies Yahoo daily ETF histories as the price source and uses distribution-adjusted returns. Its defensive basket uses equal starting weights in XLV, XLP and XLU.
[2] S&P Dow Jones Indices: S&P 500 Equal Weight Index. Index-construction reference checked 2 October 2026.
Historical educational example, not current market guidance, a trading instruction or a performance record. Read the research methodology for the wider framework.